
Most math platforms can tell you whether a student got the right answer. Almost none show you how they got there while the lesson is still happening. That gap is why Florence 1 Schools moved Algebra 1 proficiency from 46% to 81%, and why Mesa, AZ teachers use it in 95% of weeks — with no mandate requiring them to.
Formative assessment is the ongoing process of checking what students understand while they're still learning it — not after the unit ends. In math, that usually means questioning, exit tickets, quick checks for understanding, or watching students work through a problem, then using what you see to adjust instruction on the spot. The goal isn't a grade. It's information a teacher can act on before the next lesson, not after the test.
| Formative Assessment | Summative Assessment | |
|---|---|---|
| When | During instruction | End of a unit or term |
| Measures | What a student is thinking right now | What a student learned overall |
| Acted on by | The teacher, immediately | The school or district, later |
| Example | Exit ticket, hinge question, watching student work | Unit test, final exam, state assessment |
| Can't do | Prove mastery for a grade | Tell you why a student got something wrong |
Both matter. But a district that only measures at the end finds out what went wrong months after it was fixable.
Dylan Wiliam's research, cited widely in math education, names five:
Most feedback in a math classroom is delayed and binary — right or wrong, days after the work was done. Effective feedback is neither. It's specific to the work itself, arrives while the student can still act on it, and tells them what to do next — not just what they got wrong.
That's a harder standard than it sounds. A teacher grading 120 exit tickets a night can flag errors. What they usually can't do is catch how the error happened while it's still happening.
Most digital math tools speed up the same thing paper always did: check the answer, mark it right or wrong, move on. That tells a teacher what a student got wrong. It doesn't show how they got there — and at a district level, "right or wrong" is not evidence you can act on.
Students solve problems on a digital canvas, and teachers see the work — every pen stroke — while the lesson is still happening. Instead of collecting exit tickets and finding out Monday what needed reteaching Friday, a teacher sees a live heatmap of the whole class: green for correct on the first try, yellow for multiple attempts, red for a misconception in progress. By week three, most teachers are running the heatmap independently to pace the next day's lesson — not because they were told to, but because it's faster than grading.
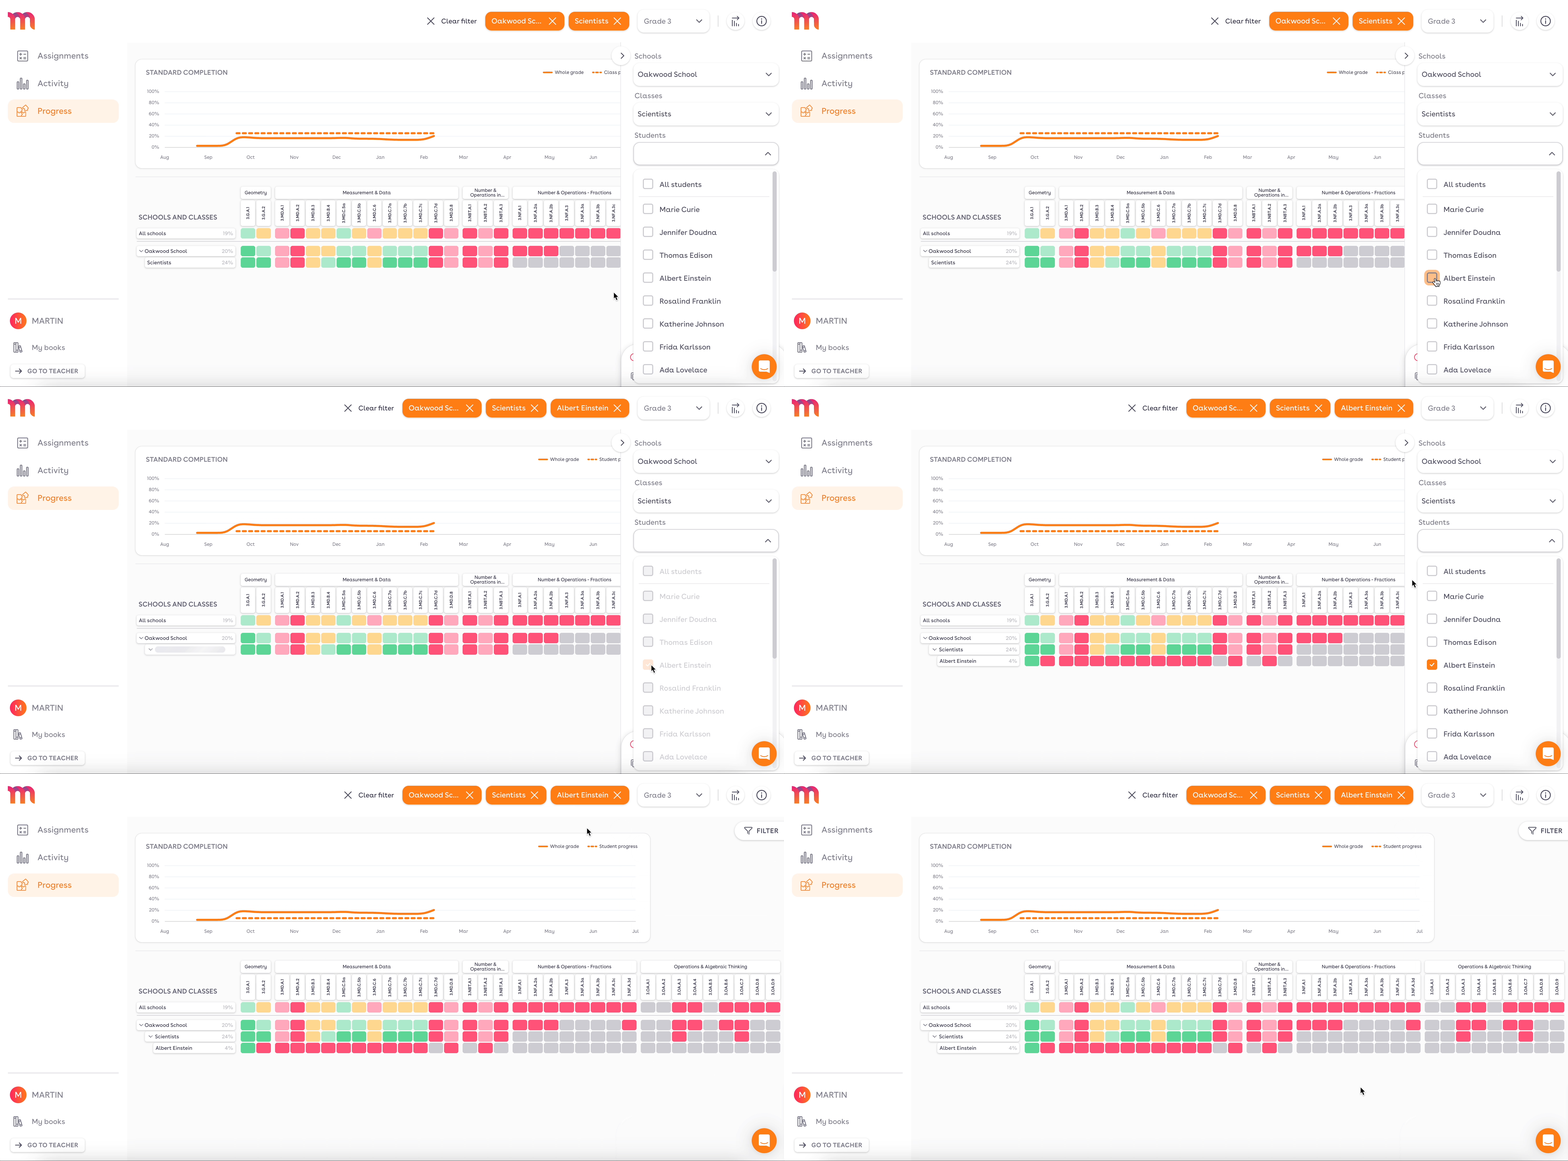
The dashboard shows standard-by-standard mastery, not a composite score — which is what a math PLC actually needs to decide what to reteach. Coaches can pull anonymized student work samples straight from the canvas to run a norming session, instead of building slides from scratch.
The District Platform rolls formative data up across schools: common formative assessment views, standard completion tracking, and problem-level analysis that shows whether a gap is isolated to one classroom or a pattern across a grade level. It sits alongside your existing curriculum and pacing — it doesn't replace either.
In Mesa, AZ, teachers used Magma in 95% of weeks with 100% license utilization — 2.6 million student work submissions, not a pilot that quietly died after the first semester. Magma also carries an ESSA Tier II evidence rating and is built around the Building Thinking Classrooms framework developed by Dr. Peter Liljedahl, who sits on Magma's advisory board.
The difference isn't speed. It's whether the data you're collecting can actually tell a teacher, a coach, or a curriculum director what to do next.
Read how Florence 1 and Alabaster used formative data to change outcomes — or see the heatmap for yourself.