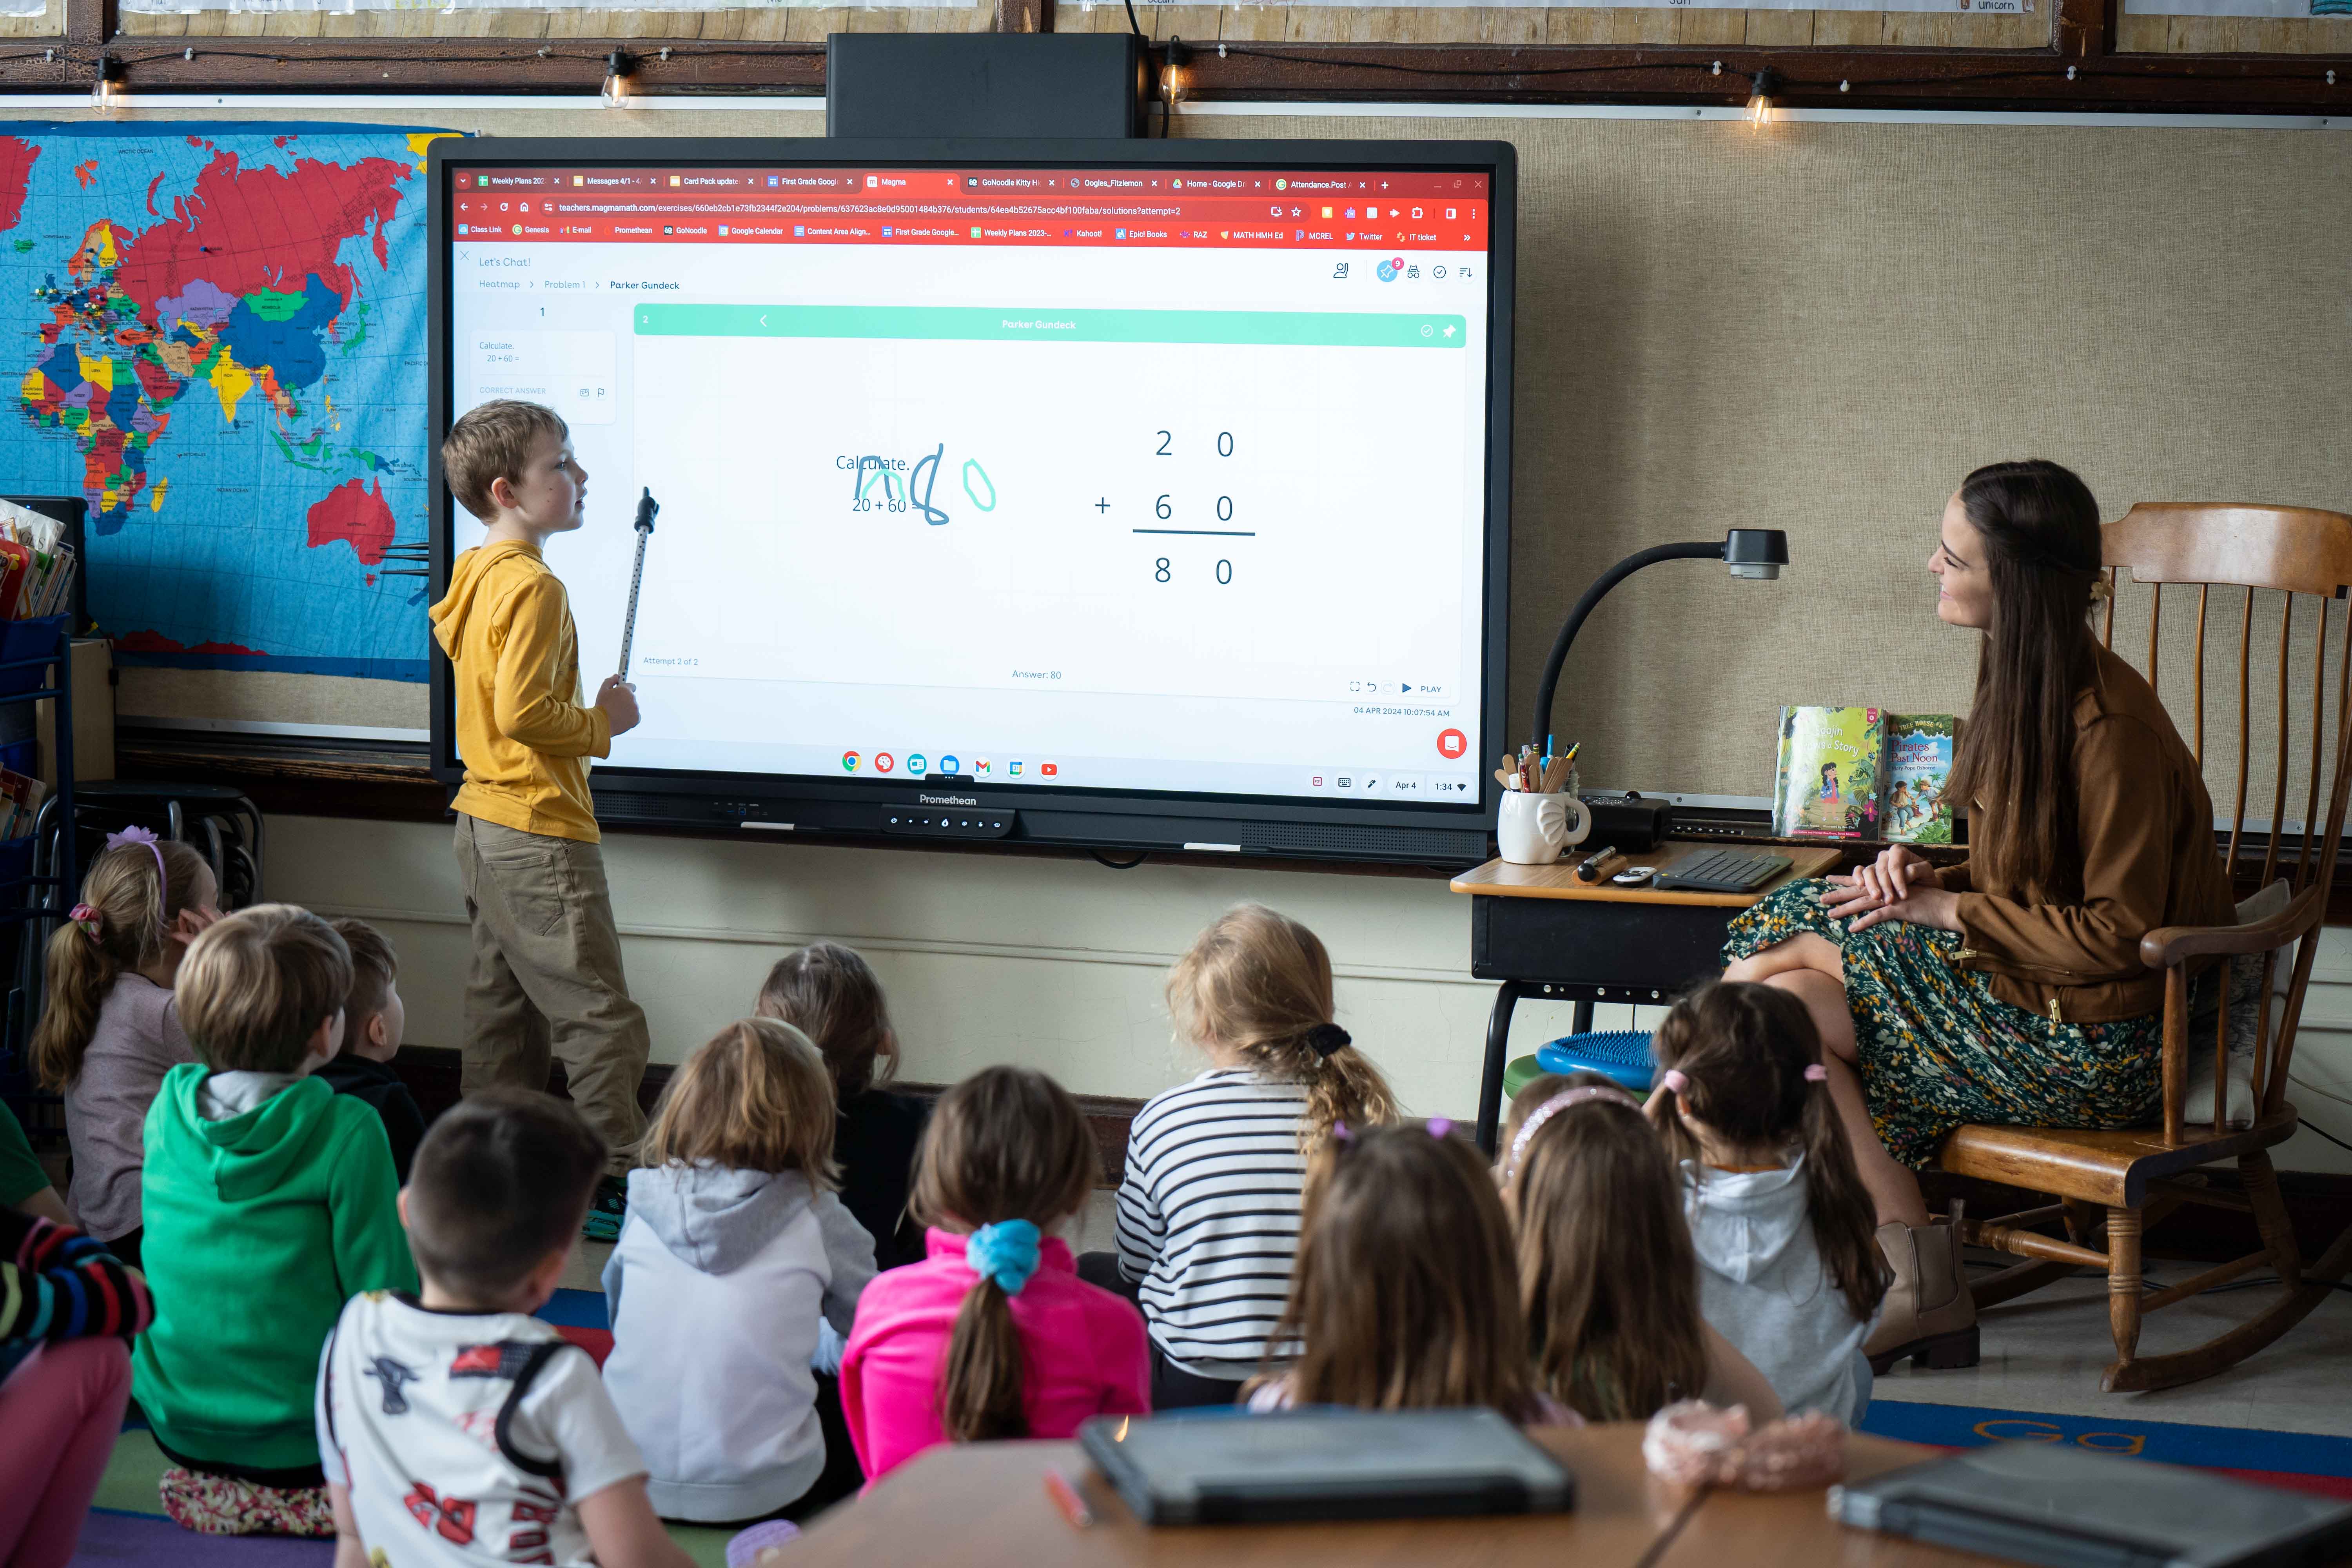


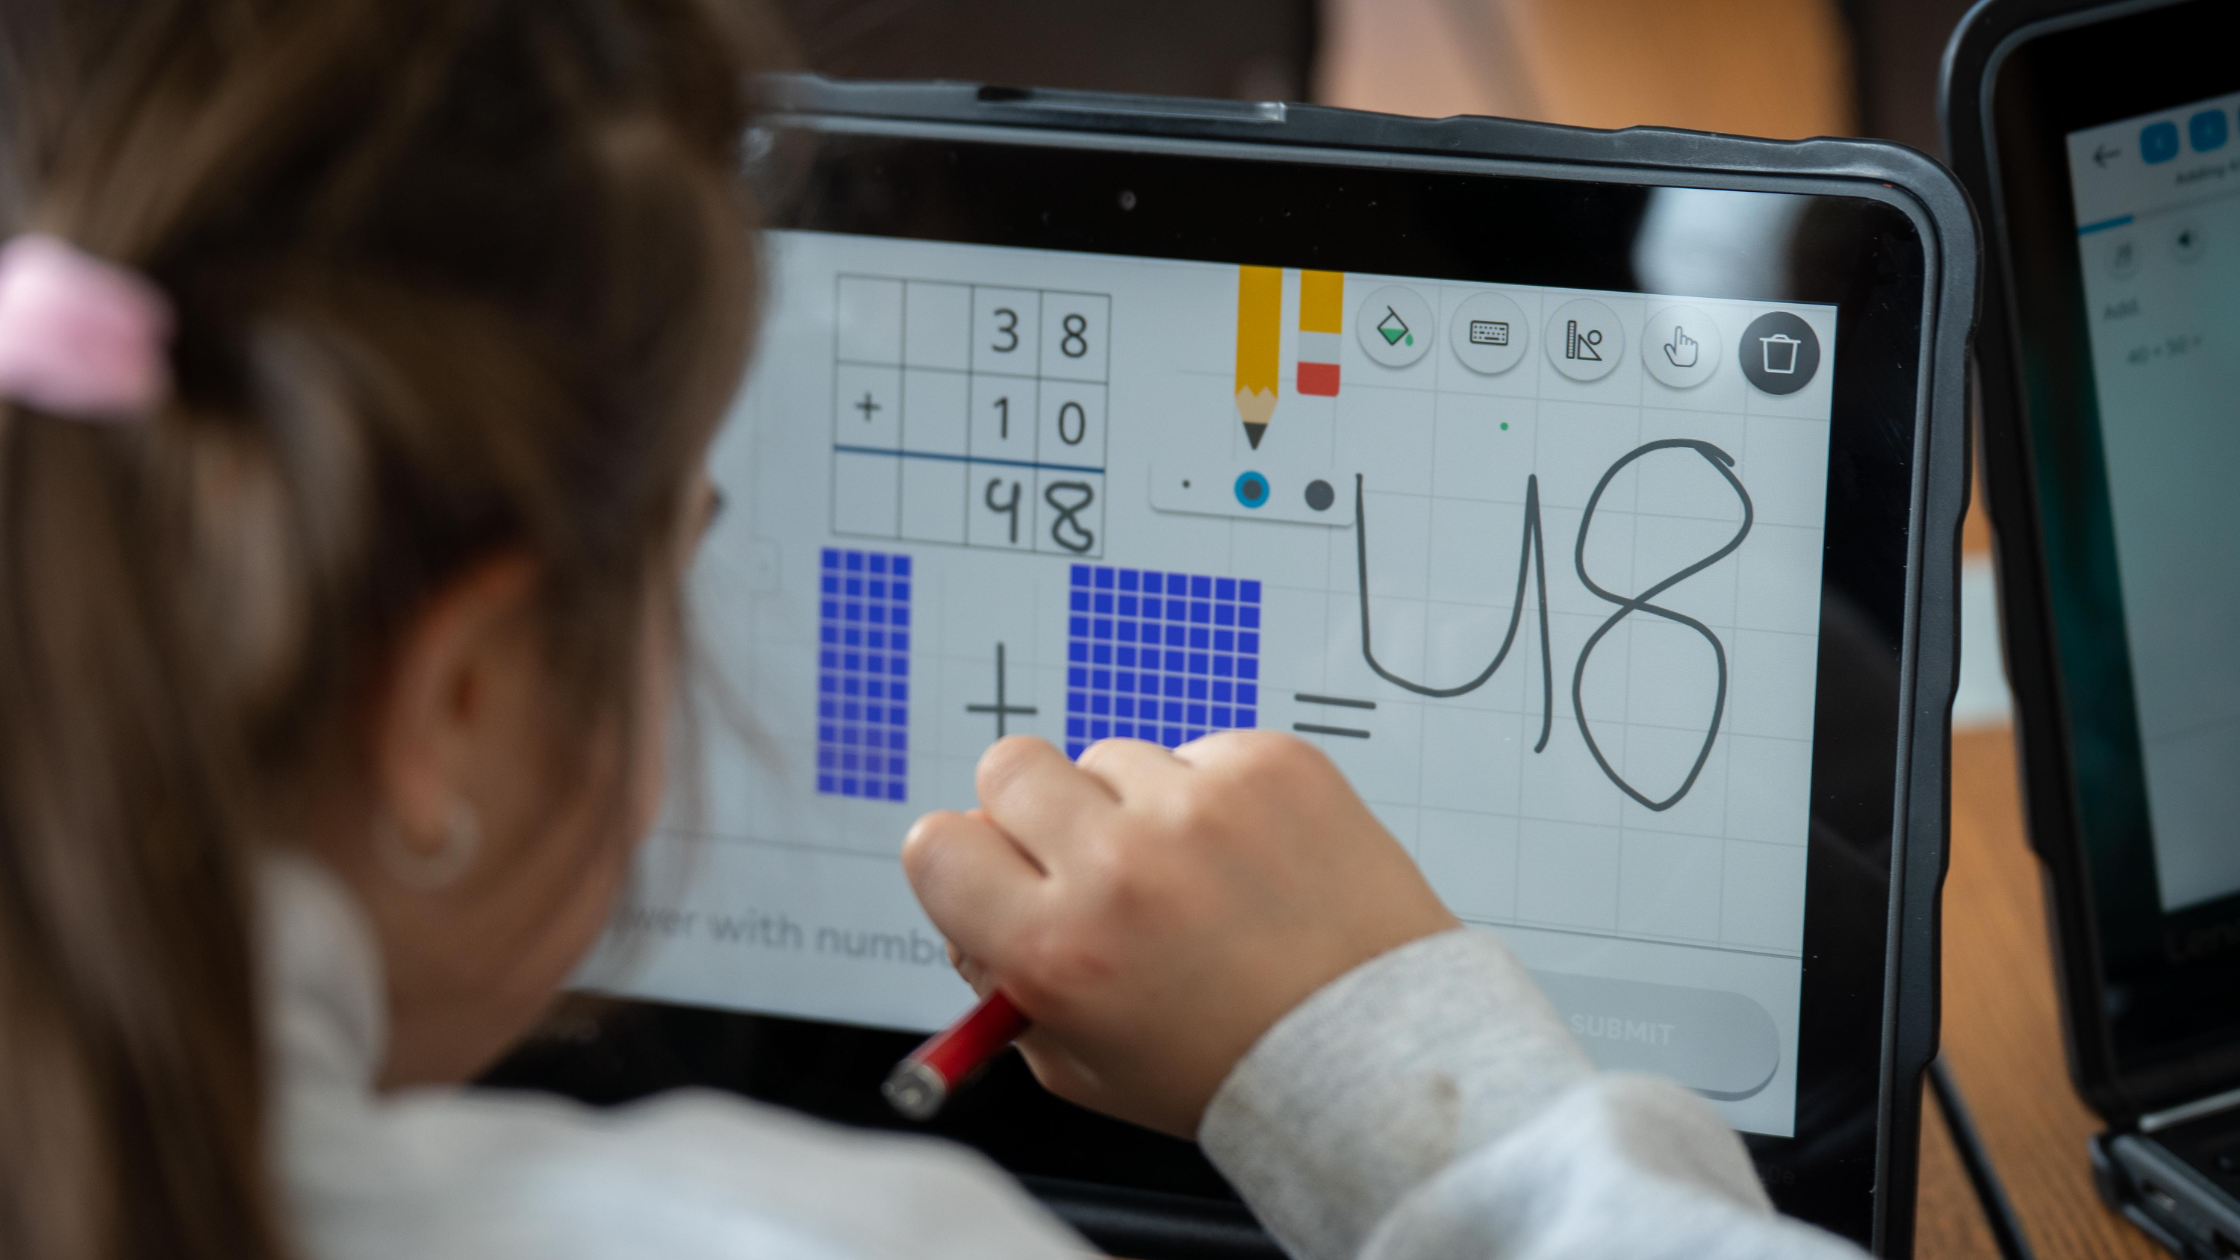
Showing your work in math means writing out the steps, strategies, models, and missteps that lead to an answer. Students have done it for generations, and teachers have always valued it, even when there isn't time to dig into it for every question. What has been missing is a sustainable way to use that work at scale. Most districts already collect plenty of it. Very little gets analyzed. It sits on scratch paper, in notebooks, and in stacks of student work samples that one teacher might skim and no one else ever sees. A coach can't spot a pattern across classrooms in work that never leaves the room, and a director can't tell whether a concept is landing from a gradebook full of percentages. Once that work is visible and easy to digest, it becomes usable data: districts can learn why students struggle and where understanding breaks down, and improve instruction, intervention, and teacher support with evidence instead of guesswork.
Digital math tools haven't fixed this. Most capture the answer and little else. They can tell you who got a problem wrong, but not whether a student misread it, chose a reasonable strategy and slipped on one step, or holds a misconception that will follow them into next year's content. Thirty students can get the same wrong answer for five different reasons, and each reason calls for a different response.
That changes when the work is captured as students solve each question, and the patterns come to the teacher instead of the teacher hunting for them. Teachers can see how each student arrived at an answer, right or wrong: which strategies they reached for, where a model fell apart, and which math mistakes keep showing up at the same step.
When student work is captured digitally, readable at a glance, and summarized across a class, analyzing it no longer depends on a teacher's spare hours. Now teachers can see both what students got right and what they understand.
How does visibility turn into instructional action?
Visibility for its own sake doesn't help anyone. Its value is in helping educators decide what to do next.
Consider a class working on fraction addition. On paper, eleven of thirty students get the same problem wrong. That's a mistake on eleven worksheets. With their thinking visible side by side, it becomes clear that all eleven added the denominators at the same step. That's not eleven mistakes. It's one misconception, and it has a clear next move.
When thinking is visible, the next instructional step gets sharper:
- Instruction: reteach the specific step where reasoning broke down, instead of the whole lesson.
- Intervention: group students by the misconception they share, not just by their score.
- Discussion: put two different strategies next to each other and let students compare their reasoning.
- Practice: assign practice that targets what students actually got stuck on.
That way, each student gets help aimed at the specific place they got stuck.
Why does this matter so much for math coaches?
Coaches are often asked to help teachers adopt more advanced practices: richer math discourse, responsive small groups, room for productive struggle in math, and selecting and sequencing student strategies for whole-class discussion, drawn from the 5 practices for orchestrating productive mathematics discussions. These practices work, but they're demanding. Monitoring thirty students' reasoning in real time, choosing which strategies to share, and planning the next move is a lot to sustain, lesson after lesson.
That's usually where good practice fades. Teachers believe in it, but it depends on extra hours they don't have. Reviewing a stack of 120 worksheets at the kitchen table isn't a sustainable way to find patterns.
When student thinking is visible as students work, the hardest parts of those practices get lighter:
- Monitoring happens on a screen as students work, not by circling the room hoping to catch the right moment.
- Selecting and sequencing strategies starts from work that's already in front of the teacher.
- Planning the next move begins with the pattern, not with hours of grading.
For coaches, that means coaching conversations can start from real student work instead of recollection, and teachers can hold a higher standard of practice without it becoming another burden. It makes the practices you already believe in sustainable, without adding another initiative.
What does seeing and understanding student work look like in Magma?
In Magma, students solve on the Student Canvas, a freeform digital workspace that works like pencil and paper. They write, draw, and annotate, so the work and the answer live in the same place, for every question.
Seeing the thinking
- Show Real Work: students who answer correctly but only scribble can't skip showing their work. The problem stays open until real work is on the canvas, so the thinking is always captured.
- Shown work on the Heatmap: the class-by-question Heatmap shows who got each problem right, how many attempts it took, and where the trouble spots are. For each problem, teachers can also see how many students showed a good calculation and filter to them.
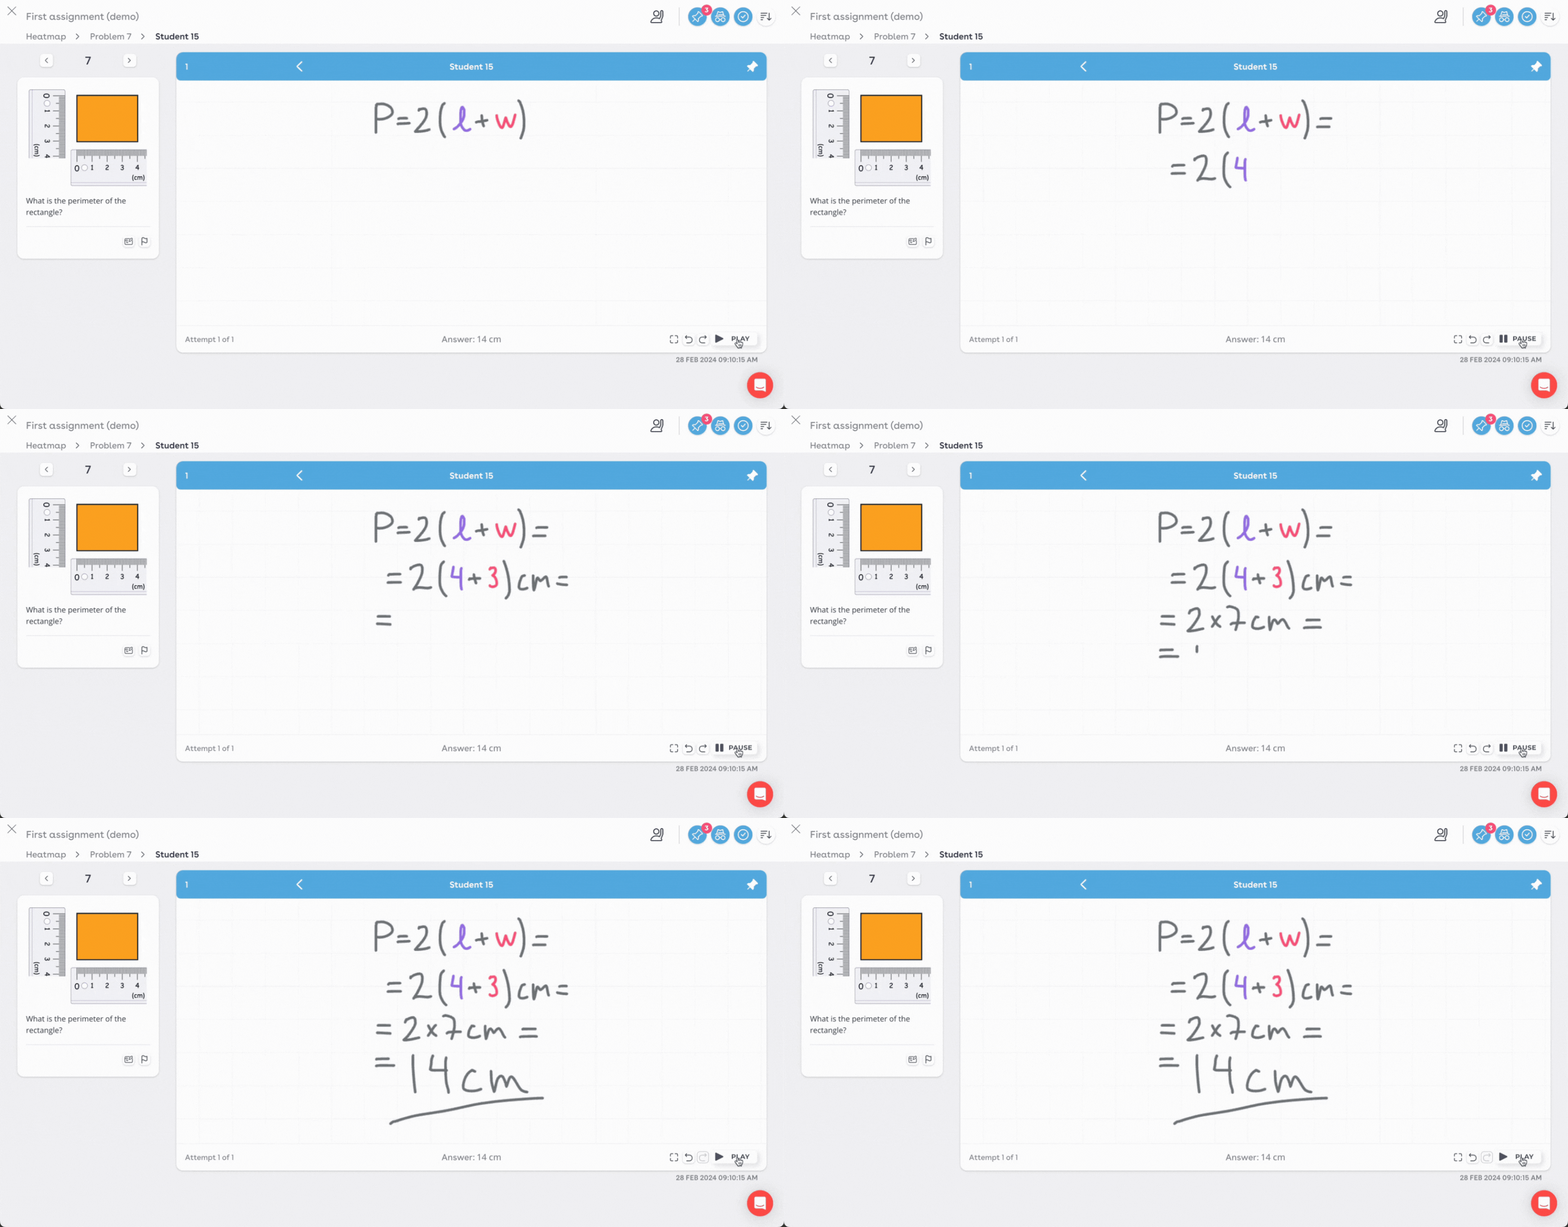
- Student Work Replay: teachers can replay a solution step by step and see exactly where it veered off.
- Magma Paper: classes that work on paper can print an assignment, solve it by hand, and scan it back into the Heatmap. Work done on paper stops being a stack to grade and becomes data.
Understanding what it means
- Error spotting: teachers see visually where in the calculation a student went wrong.
- Solution summaries: teachers can get a summary of a class's solutions, so they see the shape of the class's thinking without reading every page.
- Common Error: when several students make the same mistake, Magma flags it as a Common Error and explains the misconception behind it, so teachers know what needs reteaching.
- Common misconceptions on standards: recurring misconceptions are tied to the standard, so patterns show up beyond a single assignment.

And because the same data rolls up from student to class, school, and district, leaders can see whether a concept is landing everywhere, not just in one classroom.
The first step is simply seeing it. The rest of this series looks at what educators do with what they see, and what it looks like when that visibility scales across a district.
What is your district's student work telling you? Book a demo to find out now.